

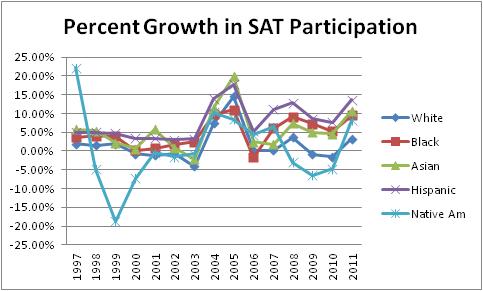
The College Board just released another year’s set of SAT results, and Steve Sailer’s blog took notice of the results and the posts that I have recently made on the subject. I try to emphasize science over conjectured analysis on this blog so that my readers can feel some confidence in the knowledge they gain here. Interpreting the SAT is complicated by many factors, including the various tweaks and reforms that the College Board has instituted and the changes in the examinee populations. However, using standard deviations should help in making group comparisons because the students are experiencing the same changes. I have tried to address the differences in demographic groups’ increased participation. In general, every group is increasing their participation more than White people. Here is a graph of each group’s increased participation from the year prior:
When one sees the raw-score graphs below, the trend of Asian advancement is obvious, which exposed the anxieties of many White people in the discussions that I saw. Analysis of the data ultimately becomes a Rorschach test of disposition towards Asian cultures. Clearly, SAT scores are revealing strengths that will serve Asians well wherever meritocracy is allowed. A common reaction from some White people to this data is to try to introduce nuance and critical analysis to emphasize flaws in Eastern societies. I think it is reasonable to conclude that every culture has its flaws, which is a strong argument for cultural exchange. However, I believe that those who are trying to champion these arguments just want to explain away Asian accomplishments to convince Whites that they are superior or at least have enough good points to raise the stock value of racial separation. I have yet to see anyone address the fact that such illustrations could have universal appeal. How does one convince the world that a group of people, like White people, is a nice group without also convincing them that the group is also a nice group to be around? Apparently, White nationalists are trying to posture that every group is nice, but only when each is separate, and mixed groups do not count. I think I can make a stronger case that the success of Asians on the SAT proves that testing is not White-supremacist. In fact, as tuition rates grow, tests are less elitist than education and, therefore, more indicative of important characteristics other than privilege.


Here is the updated graph of the Asian-White score gaps in standard deviations.

Here is the updated graph for the Black-White score gaps.

I have not given much discussion on this blog to people who self-identify as having Hispanic ethnicity or those of Native-American ancestry. I think these can be confusing designations for my purposes because I am interested in genetic research, and such groups have significant ancestral overlap, just as many American White people can claim a fraction of Native-American heritage. I find that these minority groups do not receive as much attention in the scientific literature, probably partly for this reason. Native American SAT scores are based on a relatively small and fluctuating sample size, so I caution against drawing strong conclusions from this graph.

I compiled the three Hispanic groups that the SAT delineates into a single population. The Hispanic sample has grown significantly, so an increasing gap might not surprise. However, I would have expected more changes to the verbal/critical reading score gap, either improvement from acculturation and language mastery or a worsening gap from continued immigration of young non-native speakers. Instead, the math score gap has changed more and seems to have converged with the verbal score gap. I could hypothesize that changes made to the SAT caused it to become a more g-loaded exam like an IQ test because general intelligence is a component of both exam sub-tests. This is a hypothesis that could be tested by re-assembling an older version of the test.

However, the Educational Testing Service’s principal measurement statistician Neil Dorans claimed that the 1995 recentering of the test explains this. “[O]n the original [SAT mathematical] scale, scores below 400 were compressed and scores between 400 and 700 were stretched out…. Hispanic students are 40 points higher at the median on SAT M than on SAT V on the original scale, whereas they have the same median (945) for both SAT M and SAT V on the recentered scale. Thus, the major effect of recentering for Hispanic students was to bring SAT V scores in line with SAT M scores and place both sets of scores closer to the midpoint of the score reporting scale.” He also credited recentering with bringing Asian-American SAT verbal scores “more in line with” SAT math scores. However, recentering was supposed to make each group “appear closer to average on SAT M than they appeared on the original scale,” making Asians, Whites, and men “appear less above average” and do the reverse for Black people, Hispanics, and women, without changing the “rank orderings of individuals.” I wonder if this is why the College Board does not make reports from before the recentering available to the general public. If one ignores the raw score graphs and examines the standard deviation numbers compared to White examinees that are published for Black examinees back to 1986 and for Hispanics back to 1992, one can see that the gaps between Whites and these minorities grew. Perhaps an increased sense of competitive urgency motivated White examinees more after 1995.
Any questions one might still have can be answered with a shrug. Dorans insisted we heed a heedless take on the SAT. “To believe that one set of scales represents ‘truth’ is to reify the score scales in a way that scores on general intelligence tests were reified during the first half of the twentieth century.” Then, he provided a reference to The Mismeasure of Man by Stephen Jay Gould.


2 comments:
Test prep may influence the gaps somewhat. This paper shows that whites are less likely to do test prep than Asians, blacks, and Hispanics. Here's a relevant chart from the paper.
They also studied the effectiveness of different types of test prep:
As the coefficient in Model 2 indicates, test-takers gain about 10 points on the SAT by utilizing the next-highest level of test preparation. To delineate more precisely how different types of test prep are related to SAT scores, Model 3 replaces the ordinal measure with the more interpretable categorical coding. Using books, videos or computer software with no other type of prep does not significantly boost SAT scores (although the effect is positive). The other three forms of test preparation bolster SAT scores. Compared to using no prep, taking a high-school course produces a gain of about 26 points. Taking a private/commercial course boosts scores by about 30 points and a private tutor increases scores by about 37 points. By estimating both measures of highest-level test preparation, we can see that the apparent overall boost of 10 points per unit on the scale actually stems from disproportionate gains from the higher levels of prep and no real gain from the use of books, videos or software. These estimates are much smaller than the gains of 100 points or more that test prep companies advertise. They are also more in line with results of studies that similarly account for potentially confounding factors (Briggs 2001, 2009) and smaller scale studies using data on pre- and post-test preparation SAT scores that find score gains in the range of 20-30 points (Powers 1998; Powers and Rock 1998; College Board 1999).
Could you please make the graphs a little smaller? I can almost read these.
Post a Comment